Divvy Bike Sharing Data – Take 2
After putting together a very simple example yesterday using a standard white background and default colors, I decided to have a little fun with the bicycle sharing data and attempt a visualization based on a picture of a bicycle. Though there is not a lot of graphs included on the Power BI example below, you can see how pictures can be used to add another element on the sheet. Given more time, one could also customize the colors of the elements in the graph.
To add a background image to your Power BI presentation, follow the rules below.
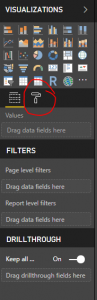
Select the background of the slide (make sure none of your visualization elements are selected).
Go to the format menu
On the format menu, you will need to navigate to the Page Background section
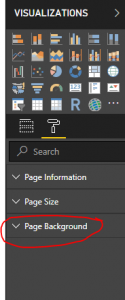
You will then need to click on the add image button and navigate to the directory where you have saved the image.
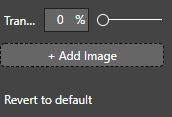
After the image has been selected, you are given additional options for customization which include transparency and image fit. In the example above, I used the “fit” option for the image and have the transparency set at 100%.
Background images expand the design possibilities within Power BI.