Adding a Custom Visualization
Power BI does not limit you to the preinstalled visualizations. Indeed, Microsoft has created a marketplace for additional visualizations which can be imported and used in your dashboards. Click the three dots in the visualization menu to get started.
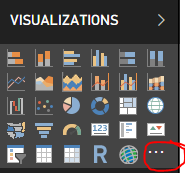
After clicking the three dots, a search menu will pop up that gives you the option of selecting a visualization from your organization or from the marketplace. For today’s purposes, I selected marketplace and searched for “Cylindrical Guage”
After importing the visualization, it will show up as an option where the three dots previously resided (the dots just moved down so you can continue to add custom visualizations).
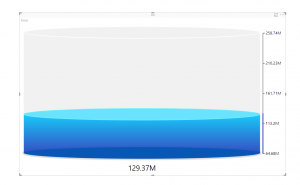
After importing the visualization, it can be used throughout the dashboard. As with the native visualizations, the custom visualizations can be customized to display various types of data.