Drilldowns
One of the best features of Power BI is the ability to add drilldowns on data. This allows the user to dive deeper into certain categories or data points based on the criteria presented in previous reports. For example, using the Divvy bike sharing data which contains several types of data, I created a pie chart based on day of the week and start station.
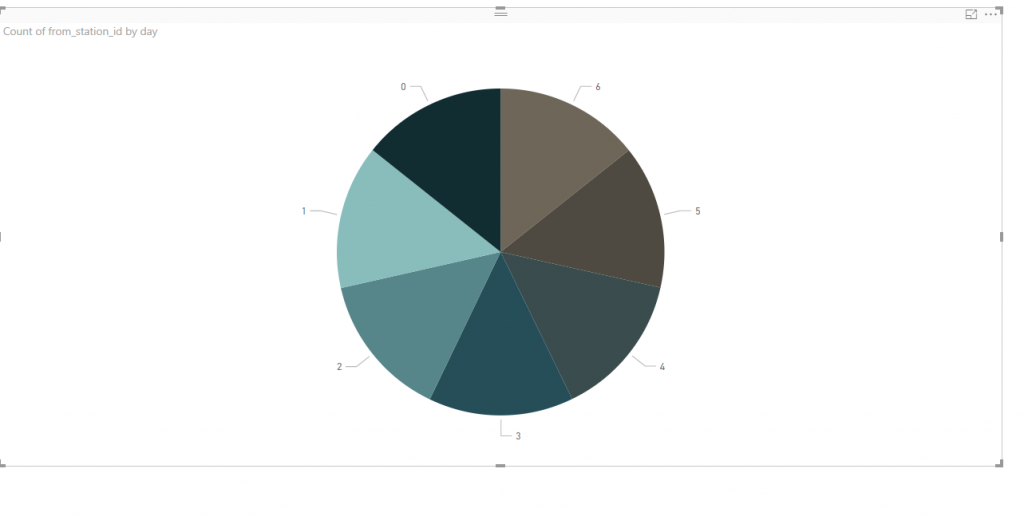
Then, right clicking on any of the pieces of the pie allows the user to select see records. This automatic drilldown allows the user to see a table showing all of the records contain.
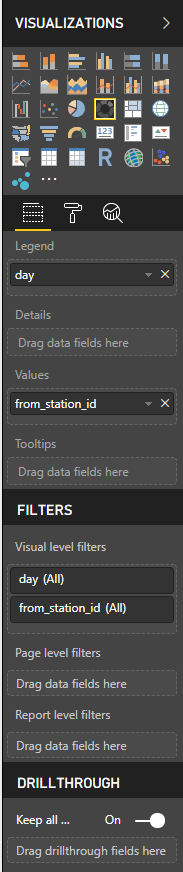
To create custom drilldowns, you can add a second page to the Power BI dashboard. On the newly created page, put the field you want to use to drill through to the last option on the options pane shown below.